COMMISSION FOR BASIC SYSTEMS
EXPERT TEAM MEETING TO DEVELOP A VERIFICATION SYSTEM ON LONG-RANGE FORECASTS
FINAL REPORT
Reading, UK, 16-20 August 1999
1. OPENING OF THE MEETING (agenda item 1)
1.1 The meeting of the Expert Team chaired by Mr François Lalaurette to Develop a Verification System for Long-range Forecasts was at the kind invitation of the ECMWF held at the Centre in Reading, UK, from 16 to 20 August 1999. The meeting was opened by Mr Dominique Marbouty, Head of Operations Department who welcomed the participants, indicated facilities available at the Centre and gave an overview of the long-range forecasting activities at the Centre. He noted that the LRF system was running at pre-operational mode and products were made available to Member States. Mr Marbouty noted that some products in particular for the tropical areas are made available on the Centre’s Web site. Mr Marbouty expressed his pleasure at the timing of the meeting in the light of the strong requirement expressed by the ECMWF council for verification and validation of long range forecast products. He wished the meeting success in its deliberations.
1.2 Mr Morrison Mlaki, Chief Data-processing System Division, WWW Department of WMO, thanked and expressed appreciation to the ECMWF for hosting the meeting of the Expert Team to Develop a Verification System for Long-range Forecasts, and welcomed the participants. He recalled that CBS-Ext. (98) approved the definition of a verification system for long-range forecasts, including a list of experimental scores to be exchanged in the first place. These procedures define the core Standardised Verification System (SVS) for long range forecasts as proposed jointly by CAS, CCl and CBS Experts.
1.3 Mr Mlaki pointed out that the two major issues before the meeting in accordance with the terms of reference of the team relate to:
Monitoring the implementation of experimental scores for long-range forecasts to be exchanged in the first place and further develop and recommend updates of the verification system.
Developing, on an experimental basis, a system to exchange verification scores for long range forecasts and sort out technical details. It will use as a basis the core Standardised Verification System for long-range forecasts as proposed jointly by CAS, CCl and CBS experts. As this evolves with time, it will require further consultation with CAS and CCl.
Deliverables expected from the team are a coordinated short-term action plan, progress report on the action plan that will include some experimental verification results and recommendations for future work.
1.4 Mr Mlaki further noted that just before Cg-XIII, an Initial Planning Meeting on Infrastructure for Seasonal to Interannual Prediction was held in Geneva. The meeting recommendations were subsequently endorsed by Cg-XIII. Cg-XIII took note amongst others of:
"General agreement that in the SI arena the components of the activities that clearly fit within the World Weather Watch/Global Data-processing System framework are the Climate Monitoring and Diagnostic Activities and the Objective Numerical Prediction Activities. Several options were considered regarding designation of SI centres within the GDPS framework and a preference expressed for the option to utilize the present RSMC designation and when appropriate create RSMCs with Climate Monitoring and Prediction Specialization. As a GDPS arrangement and enhancement of capacity for the Objective Numerical Prediction component of SI operations emerges, then the WCP/WCASP/CLIPS will focus on the development of an infrastructure to provide the international mechanism to carry out the SI Forecast and Outlook function. Expert opinion concluded that it was not possible to specify an international organizational framework for this component for the SI activity at this time. However, the Presidents of CCl and CBS should arrange for an expert group to propose standards for the formats, content and guidance information required for SI Forecast and Outlook products exchanged internationally. The NMHSs are the crucial players at the national level and CLIPS' primary task will be to develop this capacity."
1.5 Mr Mlaki noted that as the agenda of the meeting suggest the focus of this meeting is to review preliminary results of the implementation of experimental scores in various centres and on the basis of experience or new requirements, propose recommendations on updates to the CBS adopted verification system, specify arrangements and procedures to operationally use and exchange verification scores and develop a coordinated implementation action plan. He to paid tribute to all contributors to documentation for the meeting for their contributions and a wealth of recommendations, which highly facilitated the work of the meeting.
2 ORGANIZATION OF THE MEETING (Agenda item 2)
2.1 Approval of the agenda (Agenda item 2.1)
2.1.1 The meeting adopted the agenda given in Appendix II.
2.2 Working arrangements for the meeting (agenda item 2.2)
2.2.1 The meeting agreed on its working hours, mechanism and work schedule.
2.2.2 There were 8 participants at the meeting as indicated in the list of participants given in Appendix III.
3.1 Several presentations were given at the meeting summarising preliminary tests in implemented the recommended scores following the initial proposal as endorsed by CBS-Ext(98). They address both the issue of the production of scores from global, dynamical models and from empirical methods calibrated against long series of surface observations.
3.2 An important issue that has been stressed in the following discussion is that there is some danger in issuing the verification results for a limited period of time (e.g. one year) as these results are likely to bear no statistical significance; Verification in hindcast mode will therefore be of crucial importance.
3.3 It is recommended that a suitably long period of verification be used. Although the participants were aware of the limited depth of the available verification data sets and of how demanding in terms of computer resources such a recommendation may be, it was suggested that a 30-years long validation period in hindcast mode should be the ultimate objective.
3.4 It has been recommended that the verification in hindcast mode should be as close as possible to the real time operating mode (resolution, ensemble size, and parameters). In particular dynamical models should not make any use of any "future". Empirical methods should not make any use of data for a few years (one at least, ideally 5) including and following the forecasted period in deriving their regression equations in hindcast mode (cross-validation). The same restriction should apply to the bias correction used by some dynamical models;
3.5 Preliminary tests of computing RMSSS have shown that the definition of persistence as a reference to which the skill is measured is of crucial importance; it was therefore agreed to stick to the simple definition of persistence as the persistence of the mean anomaly over the period of time prior to the forecast, the period length being in agreement with the forecast (e.g. last 90-days anomaly when the forecast are averaged over 90 days);
3.6 It is likely that different verification analyses might affect the scores; therefore it has been proposed that when no gridded verification data set as defined in the Appendix I is available, then gridded verification analyses are used. Both the centre’s own analysis (if available) and ECMWF analysis could be used. As the ensemble size is likely to affect the variability of the ensemble mean used in the case of ensemble forecasts (and therefore the RMSSS), it is recommended that the ensemble size used for the computation of the ensemble mean be clearly mentionned;
3.7 It has been recognised that the problem of identification of verification data sets used in the computation of the proposed scores is of crucial importance, notably given the recommendation strongly put forward by the team that hincast mode verification be used; some clarification of available data to be used by all participating centres is therefore needed;
3.8 Two main stream of verification data have been considered: gridded data and observations; it is proposed - unlike in the original proposal – that data used for climatology and real-time verification are kept consistent between the hindcast verification and the real time verification;
3.9 The network that should ideally be used for the verification against observations should be the GCOS network both for surface and upper air observations
3.10 The meeting considered it a matter of urgency that the GCOS GSN and GUAN historical climate data be made available in digital format.
3.11 The meeting noted however that the present status of implementation of this network is not such that a central archive of climatological time series of observations are available; therefore in the absence of GCOS data, Appendix I proposes different backup proposals providing that each centre uses its own national observation dataset; in such cases, the centres having access to these datasets are encouraged to invite other participating centres to provide their forecasts in order to have them validated consistently against the same dataset;
3.12 When gridded verification datasets have been considered, an agreement was found to use the Xie-Arkin dataset for precipitation data (with a recommendation to use GPCP data over the more recent period to test the sensitivity of the results); the OI-Reynolds dataset for SSTs was also agreed; UKMO/CRU might provide the reference for 2m-T, while the UKMO/CSIRO dataset should provide the reference for MSLP; other gridded datasets (Z500, T850) should be defined; in the absence of commonly agreed references available both in quasi-real time and for the hindcast period, it is proposed that re-analysis ECMWF data and subsequent operational analyses are used as a backup; it is also recommended that the centre’s own analysis be used to assess the sentivity of the results;
3.13 In light of the two main objectives of the core standard verification system, comments on the requirements for the attachment of verification results with products made available to users and comments relevant to the exchange of scores among GDPS centres are treated as separate items in the following.
3.14 Verification results attached to the real time predictions
3.14.1 In order to provide the users with the information related to the expected skill for their area of interest, it is recommended that the information on the skill over the reference (hindcast) period be mapped at the same scale as the geographical products made available to the users.
3.14.2 Although it is recognised that such mapping might provide a high level of noise pointing to limited significance of some of the geographical skill variations, it was felt that the problem should be addressed by upscaling (aggregating) consistently the forecast products and the verification data (rather than aggregating verification data only); it has also been suggested that special care is given to educating the users to the scales limitations (e.g. to let them know that large variations in skill may exist on scales that are not properly resolved and/or sampled);
3.14.3 The scores used to bring this skill information to the user should be related to contingency tables such as the Kuiper’s skill score (hit rate minus false alarm rate) or percentage of correct forecast for deterministic forecasts. When probabilistic forecast are brought to the public knowledge the area under the ROC curve (ROC score) should be used.
3.14.4 Because the assessment of the significance of the verification results is of crucial importance for seasonal forecasts, it is proposed that significance tests such as Monte-Carlo tests are applied and published; the use of masks covering areas of limited significance should be encouraged;
3.15 Exchange of scores among GDPS centres
3.15.1 The discussion on how information on ROC should be exchanged has led to the conclusion that the most effective way should be in the form of contingency tables for deterministic products and of their probabilistic extension when available (i.e. by extending the yes/no forecast categories into suitable bins of forecasted probabilities);
3.15.2 The areas agreed for the exchange of common verification scores among GDPS centres have been kept very large on purpose in order to keep some significant information from the time series of such scores; however some limited extensions have been agreed that related to commonly agreed areas were specific phenomenon of importance for seasonal scales might happen; Mean Sea Level Pressure (MSLP) has been agreed as a new verification parameter for the extratropical areas; also the South Oscillation Index (SOI) has been included;
3.16 The meting as indicated above reviewed the verification system for long-range forecasts – Experimental scores to be exchanged in the first place and recommended the revised version mainly providing additional detail concerning both methodologies for calculation of scores and techniques for presentation of results. The Revised Version (Appendix I) also includes clarification and or additions of parameters, prediction areas and related verification data sets.
4 WORKSHOP ON RELATED VERIFICATION ISSUES INCLUDING COODINATION WITH EXISTING INITIATIVES FOR THE EXCHANGE OF RESULTS (Agenda item 4)
4.1 Canadian Meteorological Centre
4.1.1 5-, 7-, 10-, 15-day, monthly (30-day) and seasonal (90-day) forecasts of mean temperature anomalies (three equiprobable categories) are produced at a set of 240 Canadian stations. The seasonal forecasts are produced using simple linear regression equations relating the anomalies of the blended 1000-500 hPa thickness forecast by the two driving models to the surface temperature anomalies while the monthly forecasts are produced using the model mean surface temperature anomaly.
4.1.2 The 5-, 7- and 10-day forecasts are produced each day, while the 15-day forecasts are issued once a week. The monthly forecasts are issued at the beginning and in the middle of each month. Seasonal forecasts are issued at the beginning of each three-month season. Forecasts are verified by building contingency tables with the three equiprobable categories of forecast anomalies. Different verification scores are calculated from these contingency tables, including the percent correct (PC) and the Heidke Skill Score.
4.1.3 A historical forecasting project (HFP) was initiated to evaluate seasonal forecasts produced by climate (GCM) and forecast (NWP) models in hindcast mode. In 1998, the evaluation was extended by an extra 10 years, so that "Historical" forecasts or "hindcasts" are now available for 26 years of the period from 1969-1994 for each of the following four seasons: March-April May (MAM), June-July-August (JJA), September-October-November (SON) and December-January-February (DJF). This is a "forecast" type experiment in that no information not available at initial time was introduced into the forecast.
4.1.4 The hindcast period (1969-1994) has been used to assess the overall skill of the CMC long-range forecast system for both temperature and precipitation 90 day anomalies. Charts of percent correct for each season showing the overall skill of the forecast system have been produced and are attached to the forecast issued in operational mode.
4.1.5 An empirical system for forecasting 3-month mean surface temperature and total precipitation anomalies for Canada using canonical correlation analysis (CCA) has been developed. The levels and sources of predictive skill have been estimated for all seasons up to one year in advance using a cross-validation design.
4.2 Dynamical one-month forecast at the Japan Meteorological Agency (JMA)
4.2.1 JMA has been issuing a one-month forecast with dynamical method since 1996.
4.2.2 The forecast consists of mean temperature, precipitation and sunshine duration in Japan. Statistical regression equations are used to derive forecast from dynamical model output. Verification by ROC shows that the probabilistic forecast in Japan has good quality especially for temperature.
4.3 Australian Bureau of Meteorology
4.3.1 Various seasonal forecasting systems are used by the Australian Bureau of Meteorology. This includes a statistical scheme for (1a) rainfall and (1b) temperature, (2) an intermediate coupled model which provides predictions of NINO3 out to 9 months, (3) an experimental coupled atmosphere-ocean GCM. A further system forcing the BMRC AGCM with persisted SSTs is also running but in hindcast mode only.
4.3.2 Verification statistics are available for all systems though overlap with the core SVS is limited. The core SVS will, however, be embraced when finalised.
4.3.3 A wide range of verification scores are provided for (1). This includes hit rates, false alarm rates and LEPS scores. These are presented at our monthly outlook meetings but are not currently disseminated with the outlooks except in very general simplistic terms.
4.3.4 Verification is done using data analysed on a grid which covers Australia. The data sets include, but are much larger and more widely distributed than, data derived from our GCOS network. Verification against the GCOS network while useful will not be sufficient for our operational needs. Australia would therefore be keen to receive digitised hindcast and forecast information (rainfall and temperature) over Australia from other centres so that they can be verified against the more comprehensive network. The verification and dissemination of the results will proceed according to SVS guidelines.
4.4 Coordination with other verification activities
4.4.1 It is important that work done on verification is coordinated and so here we briefly review activities in this area beyond our own initiative.
4.4.2 At the 3rd session of the CLIVAR GOALS NEG-1 group (WCRP Informal Report No. 3 1999, ICPO Publication Series No. 24), CLIVAR NEG1 concluded that:
"CLIVAR NEG-1 recognized the importance of implementing the collection of forecast statistics. It was proposed that forecasts of sea surface temperature from seasonal/interannual prediction systems out to lead times of twelve months should be gathered in quasi-real time. The willingness and/or ability of groups to supply the data requested could obviously be a criterion for regarding the institution concerned as an "operational (real-time) seasonal/interannual forecasting centre". This exercise would be an extension of the COLA project (as reported by Dr. B. Kirtman above). As well as for the NINO3 area, sea surface temperatures for NINO3.5, NINO4 and Atlantic and Indian Ocean indices would be requested, possibly extending to global sea surface temperature fields. Hindcasts may also be gathered as a separate activity but this would not be an initial priority."
4.4.3 Dr. B. Kirtman, together with Dr. T. Stockdale (proposed new member of the group from 1 January 1999), were asked to lead the project. Detailed plans/proposals should be drawn up and work initiated with an invitation to all centres active in seasonal/interannual prediction to participate.
4.4.4 Given the overlap between this activity and our own, we strongly recommend that the two groups should proceed in close liaison, and to form joint plans of mutual benefit and minimal duplication. To this end, Dr. Stockdale was informally invited to attend our ET meeting but was unfortunately unavailable. The WGSIP group expects to meet later this year and Dr. Ben Kirtman has expressed interest in the possibility that one of the ET attend.
4.4.5 Dr. Mike Harrison (Chief of the CLIPS project office) reported on the many activities of his office related to use of the SVS and seasonal prediction in general. Participants were quite confident that Dr. Harrison’s very active contribution to the development of the SVS from the early stages of the proposal will ensure a high level of coordination with the CLIPS project.
5.1 Templates for exchange of scores: It was agreed that the proposed templates would need to be revised in light of discussions at the meeting. CMC volunteered to do the revisions.
5.2 Description of the forecast systems to accompany the verification: It was agreed that a description of the method of bias correction used should be added to the current list of specifications required (as in the initial SVS proposal). Results of a CLIPS questionnaire sent to forecast centres with the aim of establishing the specification of current systems should be reviewed to identify further possible additions to the SVS list of required specifications. CMC have volunteered to construct the specification list.
5.3 Lead Centre: The need for a lead centre in the SVS process was agreed. One function of the lead centre would be to maintain a central website for display of the verification exchange. (Other functions related to maintenance of verification information are covered in the annex to this paragraph.)
5.4 Methods of delivering the exchange of verification: The delivery of hindcast and real-time verification exchanges will be the same, though templates used may differ. Exchange will be to all NMHSs and other contributing forecast producers. The 4 methods proposed are;
5.4.1 Annual publication in the WWW GDPS report. Use of the GDPS report does not imply that only GDPS centres can contribute. Other centres generating forecasts on a regular basis will be invited to contribute.
5.4.2 An advance exchange of scores between all contributing centres by email.
5.4.3 The main exchange will be through each centre contributing verification to the lead centre (method to be agreed). The lead centre will then collate the contributions and display on a password protected dedicated website. The exchanged scores will be updated annually.
5.4.4 For NMHSs and other contributing centres without website facilities the lead centre will supply the exchanged verification by other means.
6. DEVELOPMENT OF A COORDINATED SHORT TERM IMPLEMENTATION PLAN (Agenda item 6)
6.1 The following schedule to establish the mechanism for exchange of long-range forecast verification scores has been agreed upon.
Activities |
Completion date |
|
Fourth quarter of 1999. |
|
First quarter of 2000. |
|
Second quarter of 2000. |
|
Second quarter of 2000. |
|
Second quarter of 2000. |
|
Second quarter of 2000. |
|
Third quarter of 2000. |
|
Fourth quarter of 2000. |
|
First quarter of 2001. |
|
First quarter of 2002 and at the beginning of each year thereafter. |
|
As soon as possible. |
6.2
CMC volunteers to participate in the preparation of the specification document in activity 1. Although all Centres are invited to participate in the exchange of LRF verification results as soon as they are ready, it has to be recognized that adjustments to the exchange process will likely be required following the experiments carried in activity 7.7. DEFINITION OF FURTHER WORK PROGRAMME AND MECHANISM FOR DEVELOPMENT OF PROGRESS REPORT TO CBS (Agenda item 7)
7.1 The meeting recommended the approval as a matter of urgency and implementation of the Revised Version of the verification system for long-range forecasts – Revised Experimental Scores to be exchanged in the first place. It recommended that the President of CBS be invited to approve the additions and clarifications to the verification system for experimental use as from end of 1999. The meeting considered that in the light of results and experience of experimental use and subsequent consultations with CAS and CCl, the fine tuned Standard Verification System will be proposed for consideration by CBS not later than its CBS-Ext. (2002) session.
7.2 The meeting considered and agreed on its short-term future work as indicated in the agreed action plan under agenda item 6. These activities will focus on:
Preparation of a specification document;
Provision of relevant climatology field, re-analysis for hindcast and verifying analyses on a central FTP Web site;
Provision of available historical GCOS data if possible;
Establish a central Web site to which all participating centres/institutes will send their verification results;
Exchange LRF verification scores for some time between NMCs represented on the CBS Expert Team to test the system and resolve unforeseen problems prior to start international exchange of LRF verification scores.
7.2.1 The meeting considered and accepted with pleasure the offer of the Canadian Meteorological Centre (CMC) to participate in the lead role in preparation of (1) the specification document that will describe in detail the mechanism for verification of long range forecasts and the calculation of all proposed scores and (2) the definition of template for exchange of verification results, tacking into account recommendations of this meeting. The meeting invited CMC to circulate its draft proposals to members of the Team for feed back as soon as it is available. Members of the team were requested to provide prompt feed back to assure adherence to the action plan schedule.
7.2.2 To facilitate timely implementation and operational success of the activities related to the short term action plan, the meeting recommended that as a matter of urgency the President of CBS should consider and designate a lead GDPS Centre on implementation and operational aspects of verification system for long-range forecasts. The designated lead centre will provide the centralised Web site functions indicated in the action plan and in 7.2 above.
7.3 The meeting considered and agreed to recommend to CBS as its future work the following issues:
Monitor the implementation and operation of experimental scores for long-range forecasts exchanged in the first place and in the light of experience and in consultation with CAS and CCl, further update the system and recommend operational regulatory procedures of the verification system for consideration and adoption by CBS;
Developing procedures for verification and exchange of results of additional SVS diagnostics, parameters and areas in the light of new requirements;
Developing procedure for provision of centralized composite analysis for use in verification;
Developing procedures for making available to users interactive user defined areas for verification;
Enhancing the verification system to meet evolving requirement of forecast developers, producers and users.
8. CLOSURE OF THE MEETING (Agenda item 8)
8.1 The meeting closed on 20 August 1999.
Annex to paragraph 5.3
Role of lead centre
Create and maintain web-site for exchange. The web-site will provide access to:
work towards:
liase with other groups involved in verification (eg WGSIP, COLA, etc.,);
collate results of limited exchange into a report for distribution;
collate information annually from 2001 for possible publication in GDPS Technical Progress Report.
APPENDIX I
VERIFICATION SYSTEMS FOR LONG-RANGE FORECASTS - REVISED EXPERIMENTAL SCORES TO BE EXCHANGED
Preamble
CBS extra ordinary (98) adopted procedures that defined the Core Standardised Verification System (SVS) for long-range forecasts, as proposed jointly by CAS, CCl and CBS experts. The Core SVS was designed to provide a straightforward assessment system for all predictions in the medium-range and longer time scales; nevertheless it can be used at the short range also. Objectives of the SVS are covered in detail in Annex 1. The two prime objectives are:
To provide on-going standardised verification statistics on real-time forecasts for exchange between GDPS centres and for annual submission to CBS.
To provide standardised methods of verification that can be attached to any real-time prediction in order that information concerning the inherent skill of the forecast system is passed to the recipient.
Proposed Principles
Verification histories may be produced through a combination of hindcasts and real-time forecasts. However the forecast method should remain consistent throughout the entire history period, with hindcasts using no information that would not have been available for a real-time forecast produced at that time. If real-time forecasts are used within the verification history then they should not be included in the verification record of real-time forecasts.
Climatologies should be calculated consistently within the verification history. Data set statistics, such as means and standard deviations, should be calculated across the period of the verification history and should be applied to verification of subsequent real-time forecasts.
Where bias correction, statistical post-processing or other forms of intervention are applied which result in differences in forecast production methodology between verification history and real-time forecast periods then an attempt may be made to verify the unmodified forecast system in addition to the real-time system with results presented for both.
1.1.1 Formulation
The SVS is formulated in four parts:
Diagnostics. Two diagnostics are included and are closely defined. Additional diagnostics are suggested but are not incorporated into the Core SVS as yet. Use of the additional diagnostics is optional.
Parameters. Key variables for initial inclusion are proposed. However the list is flexible to ensure that all producers can contribute regardless of the structure of individual forecast systems.
Verification data sets. Key data sets of observations against which forecasts may be verified are proposed. This list is also flexible to ensure that all producers can contribute regardless of the structure of individual forecast systems.
System details. Details of forecast systems employed.
Diagnostics
Two diagnostics are incorporated in the Core SVS - Relative Operating Characteristics and Root Mean Square Skill Scores. Both provide standardised values permitting direct intercomparison of results across different predicted variables, geographical regions, forecast ranges, etc. Both may be applied in verification of most forecasts and it is proposed that, except where inappropriate, both diagnostics are used on all occasions.
1. Relative Operating Characteristics. Calculation details are discussed in Annex 2. For deterministic forecasts, the full contingency table should be provided. In addition, values of the Hit and the False Alarm Rates should be supplied. Other contingency measures, as listed in Annex 4, may be added. For probabilistic forecasts maps providing the standardised area under the curve (such that perfect forecasts give an area of 1 and a curve lying along the diagonal gives 0.5) should be provided, as a map for gridded data or as a curve for single point/region predictions. Probability values should be labeled on any Relative Operating Characteristics curves.
A number of contingency table-based diagnostics are listed within Annex 4 in addition to Hit and False Alarm Rates, including the Kuiper Score and Percent Correct (both used in assessing deterministic forecasts), and these provide valuable, readily-assimilable information for developers, producers and users of long-range forecasts. They may be considered for inclusion within information supplied to users.
2. Root Mean Square Skill Scores. Calculation details are discussed in Annex 3; root mean square skill scores are appropriate only for deterministic forecasts. In general two skill scores should be provided: against persisted anomalies and against climatology. Where persistence is not relevant as a predictor (such as for some seasonal rainfall regimes) only skill against climatology should be assessed. Additionally, persistence may not be relevant once the skill of a persistence forecast is exceeded by that of a climate forecast; in this circumstance use of persistence is optional. A further three individual values (two when persistence is not used) should be provided: RMS error values for the forecast, for persistence and for climatology.
Root Mean Square Skill Scores provide useful data to the developer and producer but are thought to carry less information to the user, particularly those served by the NMHS. Hence provision of Root Mean Square Skill Scores to users is optional.
Parameters
The key list of parameters in the Core SVS is provided below. Any verification for these key parameters, for either the verification history or for real-time forecasts, should be assessed using both Core SVS techniques wherever possible (given exceptions noted above). Many long-range forecasts are produced which do not include parameters in the key list (for example, there are numerous empirical systems that predict seasonal rainfall over part of, or over an entire, country). The Core SVS diagnostics should be used to assess these forecasts also, but full details of the predictions will need to be provided.
1. Sea Surface Temperature Predictions. Predictions for:
NINO1+2
NINO3
NINO3.4
NINO4
Pacific Warm Pool (4°N to 0°N; 130°E to 150°E)
Tropical Indian Ocean ()
Tropical Atlantic Ocean ()
Other user-defined regions in all basins
[further standard areas may be defined, perhaps in association with CLIVAR-NEG1]
2. Atmospheric parameters. Predictions for:
T2m Screen Temperature with standard regions: Tropics 30°N to 30°S
Northern Extratropics >=30°N
Southern Extratropics <=30°S
For both Extratropical regions split also into separate land and oceanic regions
Tropical Africa (10°N to 10°S; 15°W to 45°E)
Tropical South America ( 10°N to 10°S; 80°W to 35°W)
Tropical South East Asia ( 10°N to 10°S; 95°E to 150°E)
NINO3 region
Precipitation with standard regions: Tropics 30°N to 30°S
Northern Extratropics >=30°N
Southern Extratropics <=30°S
For both Extratropical regions
split also into separate
land and oceanic regions
Tropical Africa (10°N to 10°S; 15°W to 45°E)
Tropical South America (10°N to 10°S; 80°W to 35°W)
Tropical South East Asia (10°N to 10°S; 95°E to 150°E)
Southern Asia (30°N to 5°N; 70°E to 90°E)
NINO3 region
500 hPa Geopotential Height with standard regions: Northern Extratropics >=30°N
Southern Extratropics <=30°S
850 hPa Temperature with standard regions: Tropics 30°N to 30°S
Northern Extratropics >=30°N
Southern Extratropics <=30°S
For both Extratropical regions split also into separate land and oceanic regions
Tropical Africa (10°N to 10°S; 15°W to 45°E)
Tropical South America (10°N to 10°S; 80°W to 35°W)
Tropical South East Asia (10°N to 10°S; 95°E to 150°E)
NINO3 region
Mean Sea level surface pressure with standard regions: Northern Extratropics >=30°N
Southern Extratropics <=30°S
Southern Oscillation Index
Tahiti-Darwin index (complete definition)
In using Relative Operating Characteristics a definition of the binary 'event' being predicted is required. While flexibility in defining the event is proposed the recommendation is that each event be either above or below normal or a tercile of the climatological distribution.
Additional diagnostics that might aid Centres in verification of long-range forecasts are listed in Annex 4.
Verification Data Sets
The key list of data sets to be used in the Core SVS for both climatological and verification information is provided below. The same data should be used for both climatology and verification, although the Centre’s (where available) and the ECMWF Reanalysis and subsequent analyses may be used when other data are not available. Many seasonal forecasts are produced that may not use the data in either the key climatology or verification data sets (for example, there are numerous systems which predict seasonal rainfall over part of, or over an entire, country). Appropriate data sets should then be used with full details provided.
1. Sea Surface Temperature
Reynolds OI, with option for additional use of GISST
2. Precipitation
Xie-Arkin; GPCP data; GCOS Network once data readily available; ECMWF Reanalysis and operational analysis data
3. T2m Screen Temperature
GCOS Network once data readily available; ECMWF Reanalysis and operational analysis data; UKMO/CRU T2m data set
4. 500 hPa Geopotential Height
ECMWF Reanalysis and operational analysis data; own centre operational analysis data if available; GUAN data once available; UKMO RS data set
5. 850 hPa Temperature
ECMWF Reanalysis and operational analysis data; own centre operational analysis data if available; GUAN data once available; UKMO RS data set
6. Sea-surface Pressure
ECMWF Reanalysis and operational analysis data; own centre operational analysis data if available; UKMO GMSLP data set
When gridded data sets are used, a 2.5° by 2.5° grid is recommended.
System Details
Information will be requested for exchange of scores concerning the following details of the forecast system; information labeled * should also be attached to user information:
Is the system numerical/hybrid/empirical*
Do the results relate to the verification history or to real-time forecasts*
Is the system deterministic/probabilistic*
Are the real-time forecasts experimental/operational and is the operational status of the system experimental/operational*
List of parameters being assessed*
List of regions for each parameter*
List of forecast ranges (lead times) and periods (e.g. seasonal average) for each parameter*
The number of hindcasts/predictions incorporated in the assessment and the dates of these hindcasts/predictions
Details of climatological and verification data sets used (with details of quality controls when these are not published)
If appropriate, resolution of fields used for climatologies and verification
The period over which data are averaged to produce persisted anomalies
Results of significance tests (Monte Carlo tests are recommended) on the historical verification period*
Bias correction
ANNEX 1
OBJECTIVES OF THE STANDARDISED VERIFICATION SYSTEM
The Standardised Verification System has two major objectives:
1. To provide a standardised method whereby forecast producers can exchange information on the quality of longer-range predictions on a regular basis and can also report annually results to WMO as part of consolidated annual summary
2. To provide a standardised method whereby forecast producers can add information on the inherent qualities of their forecasts for the information and advice of recipients.
In order to achieve the first major objective the SVS incorporates two diagnostics and a series of recommended forecast parameters and verification and climatological statistics against which to assess the forecasts which can be applied to real-time forecasts, either on an individual basis or, preferably, accumulated over a sequence of predictions.
The second major objective is achieved using the same diagnostics, forecast parameters and verification and climatological statistics but applied to historical tests of the system. It is made clear whether the historical tests are based on methods that can be considered to represent a true forecast had the test been run in real time or otherwise. Producers will be requested to add this information to issued predictions; recommendations for methods by which this might be done may be formulated later.
Other objectives of the Standardised Verification System are:
3. To encourage both regular verification of forecasts and verification according to international standards
4. To encourage information on inherent forecast quality to be added to all predictions as a matter of course and to encourage forecast recipients to expect receipt of the information
5. To encourage producers to use consistent data sets and to encourage production of these data sets
6. To provide verifications that permit direct intercomparison for forecast quality regardless of predicted variable, method, forecast range, geographical region, or any over consideration
7. To encourage producers to work towards a common method for presenting forecasts.
ANNEX 2
RELATIVE OPERATING CHARACTERISTICS
The derivation of Relative Operating Characteristics is given below. For purposes of reporting forecast quality for exchange between centers and for annual submission to WMO the following will be required:
1. For deterministic forecasts Hit Rates and False Alarm Rates together with essential details of the forecast parameter and verification data sets
2. For probabilistic forecasts Hit Rates and False Alarm Rates for each probability interval used. Frequent practice, as illustrated below, is for probability intervals of 10% to be used. However other intervals may be used as appropriate (for example, for nine-member ensembles an interval of 33.3 % could be more realistic). Additionally the area under the curve should be calculated.
Relative operating characteristics (ROC), derived from signal detection theory, are intended to provide information of the characteristics of systems upon which management decisions can be taken. In the case of weather forecasts, the decision might relate to the most appropriate manner in which to use a forecast system for a given purpose. ROC's are useful in contrasting characteristics of deterministic and probabilistic systems
Take the following 2x2 contingency table for any yes/no forecast for a specific binary event:
| FORECASTS | ||||
| YES | NO | |||
| OBSERVED | YES | Hits (H) | Misses (M) | H+M |
| NO | False Alarms (FA) | Correct rejections (CR) | FA + CR | |
| H + FA | M + CR | |||
The binary 'event' can be defined quite flexibly, e.g. as positive/negative anomalies, anomalies greater/less than a specific amount, values between two limits, etc. If terciles are used then the binary event can be defined in terms of predictions of one tercile against the remaining two.
Using stratification by observed (rather than by forecast) the following can be defined:
Hit Rate = H/(H + M)
False Alarm Rate = FA/(FA + CR)
For deterministic forecasts the Hit Rate and False Alarm Rate only need be calculated; for probabilistic forecasts the procedure outlined below should be followed.
A probabilistic forecast can be converted into a 2x2 table as follows. Tabulate probabilities in, say, 10% ranges stratified against observations, i.e.:
Probability Range |
Number of Observed events |
Number of Non-Observed events |
for each probability range |
for each probability range |
|
90-100% |
O10 |
NO10 |
80-90 % |
O9 |
NO9 |
70-80 % |
O8 |
NO8 |
60-70% |
O7 |
NO7 |
50-60 % |
O6 |
NO6 |
40-50% |
O5 |
NO5 |
30-40% |
O4 |
NO4 |
20-30% |
O3 |
NO3 |
10-20% |
O2 |
NO2 |
0-10% |
O1 |
NO1 |
Totals |
S Oi |
S NOi |
For any threshold, such as 50%; (indicated by the dotted line in the table), the Hit Rate (False Alarm Rate) can be calculated by the sum of O's (NO's) at and above the threshold value divided by S Oi (S NOi) - in other words for a value of 50% the calculation is as if the event is predicted given any forecast probability of 50% or more. So for the above case
Hit Rate = (O10 + O9 + O8 + O7 + O6) / S Oi
False Alarm Rate = (NO10 + NO9 + NO8 + NO7 + NO6) / S NOi
This calculation can be repeated at each threshold and the points plotted to produce the ROC curve, which, by definition, must pass through the points (0,0) and (100,100) (for events being predicted only for 100% probabilities and for all probabilities exceeding 0% respectively). The further the curve lies towards the upper left-hand corner the better; no-skill forecasts are indicated by a diagonal line.
Areas under ROC curves can be calculated using the Trapezium rule. Areas should be standardised against the total area of the figure such that a perfect forecast system (i.e. one that has a curve through the top-left-hand corner of the figure) has an area of one and a curve lying along the diagonal (no information) has an area of 0.5. Alternatively, but not recommended in the Standard, the 0.5 to 1.0 range can be rescaled to 0 to 1 (thus allowing negative values to be allocated to cases with the curve Iying below the diagonal - such curves can be generated). Not only can the areas be used to contrast different curves but they are also a basis for Monte Carlo significance tests. Monte Carlo testing should be done within the forecast data set itself.
In order to handle spatial forecasts, predictions for each point within the grid should be treated as individual forecasts but with all results combined into the final outcome. Categorical predictions can be treated for each category separately.
ANNEX 3
ROOT MEAN SQUARE SKILL SCORES
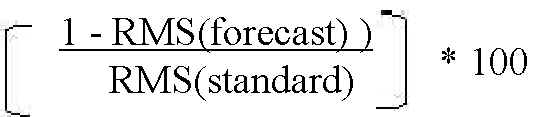
Root Mean Square Skill Scores are calculated from:
RMS (forecast) refers to the RMS error of the forecast. RMS (standard) refers to the RMS error of the standard when verified against the same observations as the forecast - the standard can be either climatology or persistence. When persistence is used, the persistence should be defined in a manner appropriate to the time scale of the prediction, although it is left to the producer to determine whether persistence over, perhaps, one month or an entire season is used in assessing a seasonal prediction. No portion of the persistence period should overlap into the forecast period and the forecast range should be calculated from no sooner than the time at which any observed information (i.e. information which could not be known at the time of a real forecast) is no longer included. Both of these requirements are placed to ensure that all forecasts and test predictions only use data that were available at the time of the prediction or would have been available at that time had a prediction been made (in the case of historical test).
ANNEX 4
ADDITIONAL DIAGNOSTICS
1. Categorical forecasts
2. Probability Forecasts of Binary Predictands
3. Probability of Multiple-Category Predictands
Ranked Probability Score
4. Continuous Forecasts in Space
5. Continuous Forecasts in Time
APPENDIX II
1. OPENING OF THE MEETING
2. ORGANIZATION OF THE MEETING
2.1 Approval of the agenda
2.2 Working arrangements for the meeting
3. RESULTS OF THE IMPLEMENTATION OF EXPERIMENTAL SCORES AND RECOMMENDATIONS ON UPDATES TO THE VERIFICATION SYSTEM
4. WORKSHOP ON RELATED VERIFICATION ISSUES INCLUDING COODINATION WITH EXISTING INITIATIVES FOR THE EXCHANGE OF RESULTS
5. SPECIFICATION OF ARRANGEMENTS AND PROCEDURES TO OPERATIONALLY USE AND EXCHANGE VERIFICATION SCORES
6. DEVELOPMENT OF A COORDINATED SHORT TERM IMPLEMENTATION ACTION PLAN
7. DEFINITION OF FURTHER WORK PROGRAMME AND MECHANISM FOR DEVELOPMENT OF PROGRESS REPORT TO CBS
8. CLOSURE OF THE MEETING
APPENDIX III
LIST OF PARTICIPANTS
| ECMWF | Francois LALAURETTE (Chairman) ECMWF Shinfield Park READING, BERKSHIRE RG2 9AX UNITED KINGDOM Tel: +44 11E8 949 9420 Fax: +44 118 986 9450 Email: f.lalaurette@ecmwf.int |
| AUSTRALIA | Scott POWER Bureau of Meteorology GPO Box 1289K MELBOURNE VIC 3001 AUSTRALIA Tel: +613 9669 4085 Fax: +613 9669 4678 Email: s.power@bom.gov.au |
| CANADA | Richard VERRET Canadian Meteorological Centre 2121 Trans-Canada Highway DORVAL, QUEBEC CANADA H9P 1J3 Tel: +1 514 421 4683 Fax: +1 514 421 4657 Email: richard.verret@ec.gc.ca |
| JAPAN | Kiyoharu TAKANO Japan Meteorological Agency 1-3-4 Otemachi, Chiyoda-ku TOKYO 1OO JAPAN Tel: +813 3211 8406 Fax: +813 3211 8406 Email: k_takano@met.kishou.go.jp |
| UNITED KINGDOM | Richard GRAHAM UK Met Office London road, Bracknell BERKSHIRE RG12 2SZ UNITED KINGDOM Tel: +44 1344 856 447 Fax: +44 1344 854 026 Email: rjgraham@meto.gov.uk |
| ECMWF | Laura FERRANTI ECMWF Shinfield Park READING, BERKSHIRE RG2 9AX UNITED KINGDOM Tel: 44 118 949 9601 Fax: 44 118 986 9450 Email: L.Ferranti@ecmwf.int |
| WMO | Morrison E. MLAKI World Meteorological Organization 7 bis, avenue de la Paix Case postale No. 2300 CH-1211 GENEVA 2 Switzerland Tel: +41 22 730 8231 Fax: +41 22 730 8021 Email: mmlaki@www.wmo.ch Mike S.J. HARRISON |