Progress Report on the Global Data Processing System 1999
European Centre for Medium-Range
Weather Forecasts
1. HIGHLIGHTS OF THE YEAR
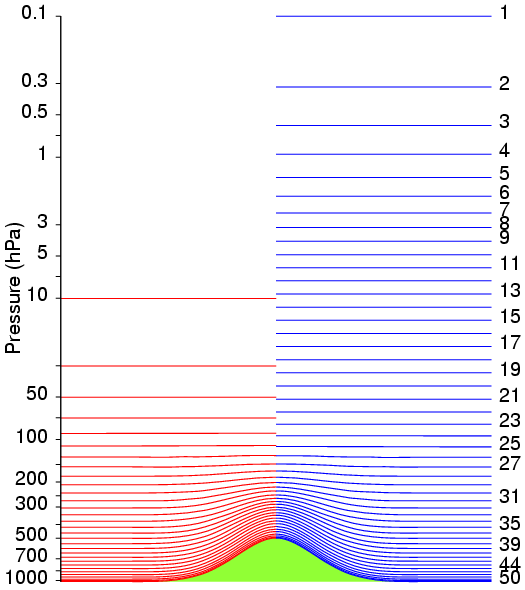
On 9 March, the reference, TL319 model had its vertical resolution extended
from 31 to 50 levels (Figure 1); extra resolution was mainly in the stratosphere and
mesosphere, with the model top moved from 10hPa to 0.1hPa.
On 5 May, raw MSU (NOAA14) and AMSU (NOAA15) radiance were introduced in the data
assimilation;
On 13 July, winds from the NOAA/FSL Demonstration Network of Profilers were activated
in the data assimilation; a screen-level humidity and temperature analysis is now used for
the optimum interpolation of soil temperature and water content; a new bias correction
scheme for radiosonde temperatures was activated, as well as a new numerical scheme for
the physical tendencies;
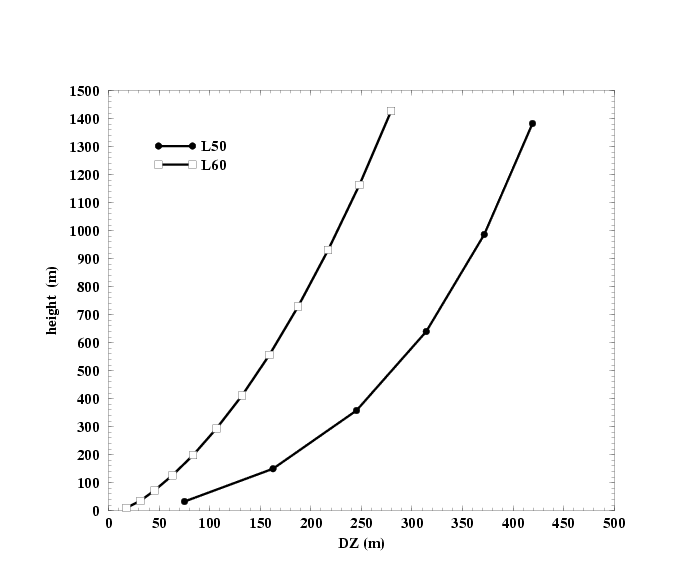
On 12 October, the reference model vertical resolution was further extended from 50 to
60 levels, while the EPS was extended from 31 to 40 levels; in both cases extra levels are
mainly in the Planetary Boundary Layer (Figure 2); a new parameterisation of precipitation
accounting for cloud and precipitation partial overlap was introduced; the prescribed
model background error statistics used in data assimilation were revised using an ensemble
of perturbed analyses; a 1D-var assimilation of SSMI winds was activated;
2. EQUIPMENT IN USE
The computer equipment in use at the end of 1999 is summarised in Table 1.
3. QUALITY CONTROL SYSTEM
The observational data used in the operational analysis (cf para. 5 below) undergo a
quality control in near real-time, after having been decoded. Each observation is subject
to a number of tests:
(i) The parameter values are compared with gross
limits for the parameter. Limits depend on latitude and, for surface parameters, also on
the season of the year.
(ii) Redundancy of information between the parameter values allows some
internal consistency checks to be performed. (iii) Temporal consistency checks on
observations from the same source are done for the position of moving platforms.
The tests have, in general, been extracted from the publication
"Guide on the Global Data Processing System", WMO-N305 1982 Chapter 6 -
"Quality Control Procedures".
Figure 1 : Vertical distribution of model levels in the 50-level implementation
introduced in operations on 9 March 1999 (right hand side); the old 31-level configuration
is shown for reference on the left hand side
Figure 2: Thickness of model layers in the PBL for the new 60-level version
implemented on 12 October 1999 compared to the previous 50-level configuration
Table 1: Computer equipment in use for operational ECMWF activities (end of 1999)
Computer |
Memory (Mbytes) |
Disk, Tape or Cartridge storage |
| Fujitsu VPP700 (116 processors) |
2048 per processor |
Disk 1.5 Tbytes |
| |
|
|
| 3 HP K series |
768 each |
Disk 400 Gbytes |
| Origin 2000 |
12288 |
Disk 40 Gbytes + 432 Gbytes (shared) |
| Origin 2000 |
4096 |
Disk 40 Gbytes |
| |
|
|
| 4 IBM RS6000 |
1536 each |
Disk 600 Gbytes |
| |
|
Two 3494 tape robot each with 16 x 3590 tape drives |
| IBM SP with 4 x R40 "high nodes" |
8192 |
Disk 2 Tbytes |
| |
|
Three StorageTek silo with 12 x 3590 tape drives |
| |
|
|
| 2 VAX 4100 |
128 |
Disk 7.5 Gbytes One tape unit |
4. MONITORING OF THE OBSERVING SYSTEM
The operational monitoring of all data types continues to provide the basis for
decisions on the operational use of the data. The quality of observations is monitored in
non real-time, based on statistics of the departures between the data and the operational
6-hour forecasts and analyses. All data types used in the data assimilation system are
monitored in that way.
Results are published in a monthly Global Data Monitoring Report, provided to GDPS
centres participating in data monitoring activities and to the WMO Secretariat (further
copies can be obtained from ECMWF on request). Feedback is also provided directly to data
producers.
The Centre has continued to fulfil its rôle of lead centre for radiosonde and pilot
data monitoring as requested by WMO, including co-ordination and liaison with other lead
centres.
5. FORECASTING SYSTEM - DECEMBER 1999
Model:
Smallest half-wavelength resolved:
63 km (triangular spectral truncation 319)
Time-step: 20 minutes
Numerical scheme:
Semi-Lagrangian, semi- implicit time-stepping formulation.
Number of grid points in model:
8,300,760 in upper-air, 553,384 in land surface and sub- surface
layers. The grid for computation of physical processes is a reduced, linear Gaussian grid,
on which single- level parameters are available. The grid spacing is close to 62km.
Variables at each grid point (recalculated at each
time-step):
Wind, temperature, humidity, cloud fraction and water/ ice
content (also pressure at surface grid-points)
Physics:
orography (terrain height and sub-grid-scale),
drainage, precipitation, carbon dioxide, temperature, ground humidity, snow-fall,
snow-cover & snow melt, radiation (incoming short-wave and out-going long-wave),
friction (at surface and in free atmosphere), sub-grid-scale orographic drag - gravity
waves and blocking effects, evaporation, sensible & latent heat flux, oceanic waves.
Data Assimilation:
Analysis: Mass & wind (four-dimensional
variational multi- variate analysis on 31 model levels)
Humidity (four-dimensional variational analysis on model levels
up to 250 hPa)
Surface parameters (sea surface temperature from NCEP Washington
analysis, sea ice from SSM/I satellite data), soil water content, snow depth, screen level
temperature and humidity
Data used: Global satellite data (SATOB, (A)TOVS, ERS2,
SSM/I), Global free-atmosphere data (AIREP, AMDAR, TEMP, PILOT, TEMP/DROP,
PROFILERS), Oceanic data (SYNOP/SHIP, PILOT/SHIP, TEMP/SHIP, DRIBU), Land data (SYNOP).
Data checking and validation is applied to each parameter used. Thinning procedures are
applied when observations are redundant at the model scale.
Ensemble Prediction System:
Initial perturbations generated from singular vectors at T42 resolution. 10-days
forecasts are perturbed through random perturbations of the physical tendencies
(stochastic physics).
50 ensemble members at TL159 resolution (linear grid), 40 levels
Dissemination of analyses and forecasts to Member States:
via a dedicated telecommunications network (mainly 64,000 bits per second) connecting
the ECMWF system with the computer systems in the meteorological services of the 17 Member
States and four co- operating States
dissemination requirements updated (and repeat transmissions requested) by individual
Member States
Dissemination to non-Member States:
via the Global Telecommunications System, network (50 to 64,000 bits per second)
operated under the World Weather Watch of the World Meteorological Organization,
connecting the meteorological services of all countries of the world
Parameters:
Free atmosphere:
A Geopotential height at 500 hPa
B Temperature at 850 hPa
C Wind at 850 & 200 hPa
Surface:
D Mean-sea-level pressure
Time-steps:
A, B, C, D: one analysis time-step (12 UTC current day)
A, B, D (NH,SH): seven forecast time-steps (24 to 168 hours at 24-hour
intervals)
C (tropics): five forecast time-steps (24 to 120 hours at 24-hour
intervals)
Horizontal resolution:
5 x 5 degrees (dissemination in code GRID) and 2.5 x 2.5
degrees (dissemination in code GRIB)
Dissemination to the African Centre of Meteorological
Applications for Development (ACMAD):
via METEOSAT MDD Specific parameters for the African
region
Dissemination to EUMETSAT:
A range of ECMWF products are sent daily to the Meteorological Product Extraction
Facility at EUMETSAT to aid in retrieving cloud motion winds from METEOSAT. The ECMWF
products are used for calculation of sea surface temperature and to assign cloud top
heights to pressure levels.
Dissemination to the European Space Agency:
A range of ECMWF products are sent daily to ESA to aid in processing data from the ERS
satellites.
Management of the operational suite
The processes forming the operational suite and the research experiments are managed
and controlled by a Supervisor - Monitor - Scheduler (SMS) system. Many suites can be
controlled under one SMS; alternatively, several versions of SMS may run simultaneously.
Data archives and services
Demand for data from the Centre's archives of grid products, provided for research by
ECMWF data services, continued to grow. A brochure describing available services can be
obtained from ECMWF on request.
6. VERIFICATION OF PROGNOSTIC PRODUCTS IN 1999
Average of the monthly WMO/CBS standard scores for 1999:
VERIFICATION AGAINST ANALYSIS
|
|
24 hr
|
72hr |
120hr
|
North. Hemisphere
|
500-hPa height RMS (m)
|
12.1
|
31.9
|
57.8
|
South.
Hemisphere |
15.9
|
41.6
|
71.0
|
North. Hemisphere
|
Wind RMSVE 250 hPa (ms-1)
|
5.3
|
10.5
|
15.6
|
South.
Hemisphere |
5.8
|
11.7
|
17.2
|
Tropics
|
Wind RMSVE 850 hPa (ms-1)
|
2.6
|
3.7
|
4.2
|
Tropics
|
Wind RMSVE 250 hPa (ms-1)
|
5.0
|
7.7
|
9.2
|
VERIFICATION AGAINST RADIOSONDES
|
| |
24 hr
|
72hr
|
120hr
|
North America
|
500-hPa height RMS (m)
|
14.0
|
33.2
|
59.1
|
Wind 250 hPa (ms-1)
|
6.8
|
12.0
|
17.7
|
Europe
|
500-hPa height RMS (m)
|
13.5
|
31.5
|
62.9
|
Wind 250 hPa
(ms-1) |
6.3
|
11.1
|
17.9
|
Asia
|
500-hPa height RMS (m)
|
15.5
|
26.1
|
39.8
|
Wind 250 hPa (ms-1)
|
7.0
|
10.4
|
13.6
|
Australia/NZ
|
500-hPa height RMS (m)
|
11.6
|
24.8
|
43.3
|
Wind 250 hPa (ms-1)
|
6.8
|
10.2
|
14.1
|
Tropics
|
Wind 850 hPa (ms-1)
|
4.0
|
4.5
|
5.0
|
Wind 250 hPa (ms-1)
|
6.2
|
7.8
|
9.2
|
North Hemisphere
|
500-hPa height RMS (m)
|
14.8
|
32.8
|
59.3
|
Wind 250 hPa (ms-1)
|
6.6
|
11.2
|
16.6
|
South Hemisphere
|
500-hPa height RMS (m)
|
16.0
|
33.5
|
57.1 |
Wind 250 hPa (ms-1)
|
7.4
|
11.6
|
16.3
|
|