Abstracts of presentations made at the
Scientific and Technical Workshop during the
Fifth Session of the JCOMM Ship Observations Team (SOT)
Geneva, Switzerland, Monday 18 May 2009 (9h30 - 12h30)
New initiatives and/or new developments in shipboard meteorological or oceanographic instrumentation, observing practices, data management procedures, quality control and ocean products.
1. New developments / Updates in VOS Electronic logbook software
By Naotaka Hiraishi, Japan Meteorological Agency (JMA), Japan
1.1 ObsJMA
New developments / Updates in OBSJMA for WIN
OBSJMA for WIN is a software application designed to assist in encoding marine meteorological observational data easily and accurately on Windows PCs. The Japan Meteorological Agency (JMA) has distributed it to Japanese VOS free of charge since September 2002.
In March 2009, the JMA started to distribute the latest OBSJMA for WIN Version 2.00.
OBSJMA for WIN Version 2.00 can work with Windows Vista OS. In addition, it has new added features including a more detailed pressure correction scheme for accurate reporting. The outlines of the upgrade will be described at the meeting.
2. New developments / Updates in SOOP software
By Gustavo Goni, NOAA Atlantic Oceanographic and Meteorological Laboratory (AOML), USA
2.1 New AOML visual quality control software
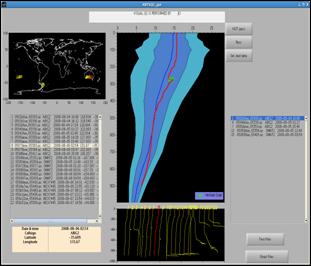
The Visual Quality Control (VQC, Figure) is a Graphical User Interface (GUI) developed at AOML Miami that allows a user to approve or reject XBT profiles that have not met the minimum specified standards of the Automatic Quality Control System. Accepted profiles are automatically sent to the GTS. When the operator rejects a profile, the data-flow process automatically receives a message not to place that profile in the GTS. AOML does a VQC for an average of several tens of profiles every month. This can vary dramatically if there are high-density cruises being done or communication problems. A useful advantage of the VQC is the real-time ability to recognize systemic and random problems with the XBT operations that are not identify by the automatic QC. Such problems could be electrical faults in the XBT hand-launchers, or bad weather carrying the XBT wires to contact the hull of the ship. The AOML VQC system is an upgrade of the previous VQC Matlab script used in Silver Spring. The upgrades include incorporating geographical position, proximity to profiles obtained by Argo floats in time or position, and an easy to use GUI. The VQC GUI provides the user with error envelopes corresponding to 5 and 10 standard deviations. Additionally, all flagged profiles in the queue are shown in a secondary graph to easily visually compare physical features. The GUI has user-friendly mouse enabled features such as zoom and profile selection. The system allows for introducing quality control flags, which will be useful once the BUFR format is implemented.
Figure: Screen shot of the new AOML Visual Quality Control (VQC) for XBT profiles. The main graph displays an envelope of 5 and 10 standard deviations, the climatology (blue line) and the XBT profile (red line).
2.2 Implementation of Iridium transmissions in SEAS XBT transects
Most XBT profiles from AOML SEAS operations are transmitted through the Thrane Standard Cunits. In a recent development, the AOML shows it is transmitting via the Iridium exclusively for the XBT and continuous TSG operations on the Oleander (AX32) using a direct Internet connection and SMTP e-mail.
2.3 Implementation of TSG transmission using Iridium in SEAS TSG operations
During 2008, the TSG Iridium transmission system was successfully tested in the M/V Explorer and on the M/V Oleander. The SEAS 2000 software was implemented for easy setup and requires no user input once initiated. The SEAS 2000 software contains a TSG Server (TSG data reader) module, a TSG Transmitter module and a Time Server module.
On these ships, the TSG Server, Transmitter and Time Server software modules reside on the SEAS 2000 computer in the bridge or tech room. The TSG instrument resides in the engine room and outputs data into the TSG junction box. The TSG Server module on the computer collects TSG data from the TSG junction box through a serial cable. An alternative setup would be that the TSG Server computer resides in the engine room with the TSG instrument and passes the TSG data to the TSG transmitter computer via serial or internet cables.
The TSG data is time position stamped in one of two ways. The TSG data could be time/position stamped with a GPS fed directly into the TSG junction box and thus the TSG Server reads in the TSG data with the time stamp. Or more typically an independent GPS is fed into the serial port of the SEAS 2000 computer and read by the Time Server module, which then time position stamps the TSG data.
Finally, the TSG Transmitter software module receives the time position stamped TSG data from the TSG Server (on the same computer or the engine room SEAS computer). The TSG Transmitter then transmits the data via Iridium at user-selected intervals.
By Graeme Ball, Bureau of Meteorology (BOM), Australia
Over many years, the Australian Bureau of Meteorology has used paper forms to record VOS metadata at recruitment, and to update the metadata at subsequent ship visits. These metadata are then entered into a database from which a variety of reports, including WMO No. 47, is automatically generated.
Following the changes to WMO No. 47 in July 2007, the VOSClim Form 001, which the Bureau had been using, became ineffectual due to the requirement for additional metadata elements and a different metadata reporting order. The Australian Bureau of Meteorology, through its Marine Operations Group, subsequently developed a Word-based form that could be completed and submitted electronically by its contracted PMAs. Coincident with the changes to WMO No. 47 and the Bureau's intention of reporting its ship's metadata in XML, an Excel-based application was developed to produce the quarterly WMO No. 47 XML metadata exchange file.
The VOS Form VOSP002 and its companion metadata viewer, and the Pub47 XML Generator are all modelled extensively on the equivalent applications used routinely by the Australian Bureau of Meteorology.
4. E-SURFMAR VOS database (overview and demonstrations)
By Jean-Pierre Kerserho, Météo-France, France
The VOS metadata is essential for the daily monitoring, performance evaluation and calculation of financial compensations to E-SURFMAR members. A metadata database has therefore been developed to assist with this exercise. Available online, it allows easy management of the Pub. 47 fields. CSV and XML files can be uploaded or downloaded, and the metadata can be updated manually or through the VOSP002 form. The database manages MASK callsign records and permits digital images of the ships and instruments to be uploaded.
European VOS operators submit their updated metadata for addition to the database on a monthly basis. The database is then used to regularly provide WMO with Pub. 47 metadata for E-SURFMAR VOS (every quarter) and to provide JCOMMOPS with the MASK/REAL cross-reference list.
The presentation of the database includes a live online demonstration. Its characteristics and performances are illustrated through a few examples of use.
5. E-SURFMAR specifications of AWS (list of recommendations for issuing specifications)
By Henry Kleta, Deutscher Wetterdienst (DWD), Germany
In 2008, E-SURFMAR established a task team on shipborne Automated Weather Stations (AWS). The task team is a sub-group of E-SURFMAR's VOS Technical Advisory group.
The main purpose of the task team is to define and agree specifications, which would be used in calls for tender for the procurement of basic and complex AWS used on observing ships recruited by E-SURFMAR participants (European meteorological services).
The task team went over existing systems, current developments, and requirements from participating national meteorological services (NMS), issues concerning the installation and maintenance of such systems, operating costs including amortization of the equipment as well as suitable sensors and communication systems. The possibility for a station to report visual observations (complex AWS) was considered as being optional for the basic AWS.
During the work of the task team, it became clear that the requirements of the participating NMS are covering a very wide range from a very simple AWS to a very complex AWS. Due to this, it was decided that it was not feasible to create one single set of specifications.
Instead, it was decided that a report be issued providing recommendations agreed by the team. These recommendations - based on the requirements of the participating NMS - are shown in the final report. In addition to those recommendations, some specifications are shown as example.
This final report is the subject of the presentation.
6. The Scientific analysis of VOS and VOSClim data (updated report)
By David I. Berry, National Oceanography Centre (NOC), Southampton, UK
Bruce Ingleby, Met Office, Exeter, UK, and
Elizabeth C. Kent, NOC
The aim of this presentation is to highlight the continued importance of VOS and VOSClim data from a climate research perspective.
The presentation will commence with a review of recent progress made in climate research activities using VOS data, including climate assessments, air-sea interaction studies and satellite validation. Estimates of the uncertainty in gridded fields of the VOS observations will also be presented, demonstrating the impact of the loss of callsign information, and both the quantity and the quality of data on the uncertainty in data fields calculated from VOS.
This will be followed by a review of VOSClim and how it contributes to the wider VOS and the global climate observing system. Results of a recent comparison of observations and model output will also be given. The reports from VOSClim ships are shown to have fewer errors than from ordinary VOS for both air and sea temperatures. The improvements from automated weather systems will also be shown. A number of suggestions will then be made on how to increase the scientific exploitation of the VOSClim dataset.
7. VOS Quality Control Tools at Météo France (overview and demonstration)
By Pierre Blouch, Météo France, France
Since Meteo-France became responsible for the European Surface Marine Observations programme of EUMENET (E-SURFMAR), quality control tools developed for the buoys were extended to the ships. During the first few years, air pressure data reported by EUMETNET ships were monitored as a matter of priority. The quality of measurements reported by conventional VOS appears, on average, to be worse than that of the Automated Weather Stations. Human readings often introduce non-systematic errors on sea level pressure observations. Double correction of the pressure height of the barometer above the waterline is a common error, although TurboWin includes warnings to the observers.
Recently, the E-SURFMAR monitoring tools have improved, new features have been included and more parameters are now compared to model analysis. Humidity as well as wave height and period have been added. ECMWF analyses are now used in addition to those of Meteo-France (Arpege model) and a sea/land mask is now applied on all parameters except air pressure. Interpolations of model outputs at the locations of the ships are more representative of the conditions at sea. The height of the anemometer is also used (if present in the metadata) to bring the wind speed measured by the ship at the model level (10 metres) in a standard atmosphere, before comparison.
The presentation of the monitoring tools includes a live online demonstration. The characteristics and performances of the tools are illustrated through a few real-time cases.